In this tutorial, we’ll show you how to create reports in Not Just Analytics.
A report lets you compile and organize data from your Instagram profile into a document, useful for:
✅ monitoring performance over time
✅ sharing data with your team or clients
✅ analyzing results in detail
📌 The type of report and available features depend on your subscription plan. Some options may be limited based on your membership.
1️⃣ Access the Report feature
To get started, follow these steps:
- Log in to Not Just Analytics with your account.
- From the main menu, click ‘Report’.
📌 Inside the Report section, you’ll find different options for managing your reports:
- scheduled reports: check the reports you’ve set to generate automatically.
- report history: view already completed reports.
- drafts: access reports you’ve started but haven’t finalized yet.
If you want to create a new report, move on to the next step!
2️⃣ Creating a new report
To generate a report, follow these simple steps:
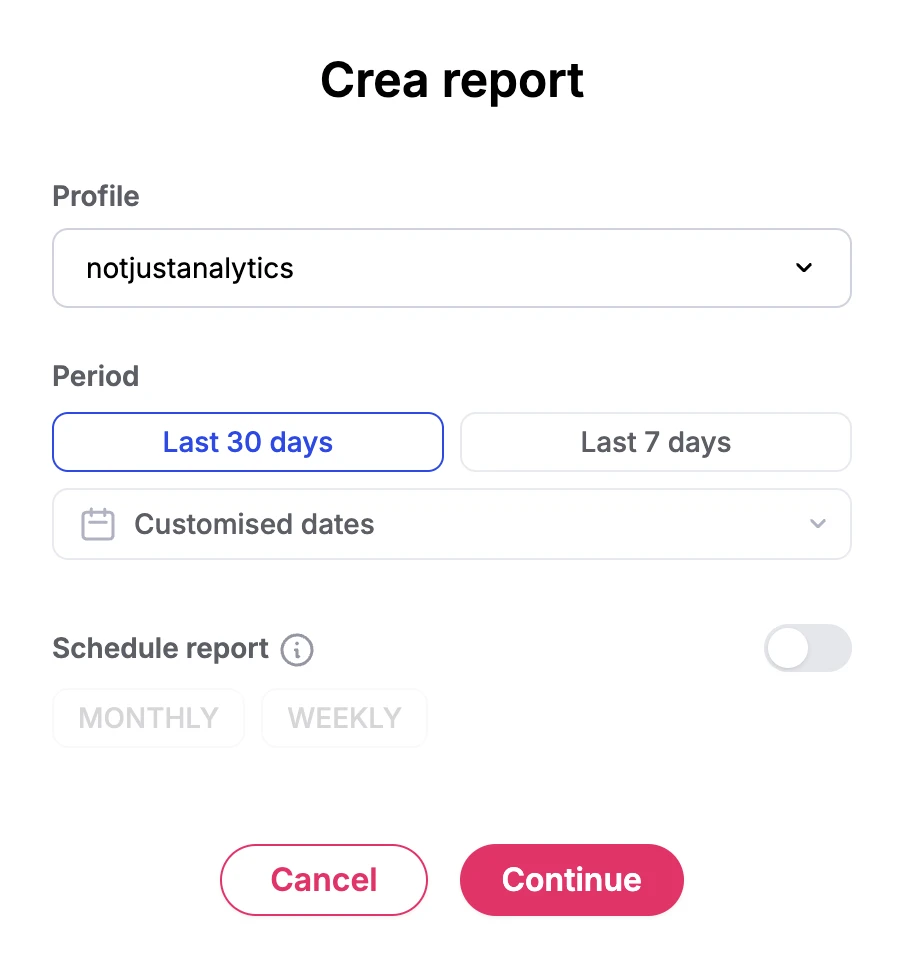
- Click ’Create Report’ to begin.
- Select the Instagram profile you want to generate the report for.
- Choose the date range for the analysis. Depending on your subscription, you can pick from various options (e.g., last 7 days, last 30 days, custom range).
- After choosing the date range, click ‘Continue’ to move to the report configuration.
3️⃣ Configure the report
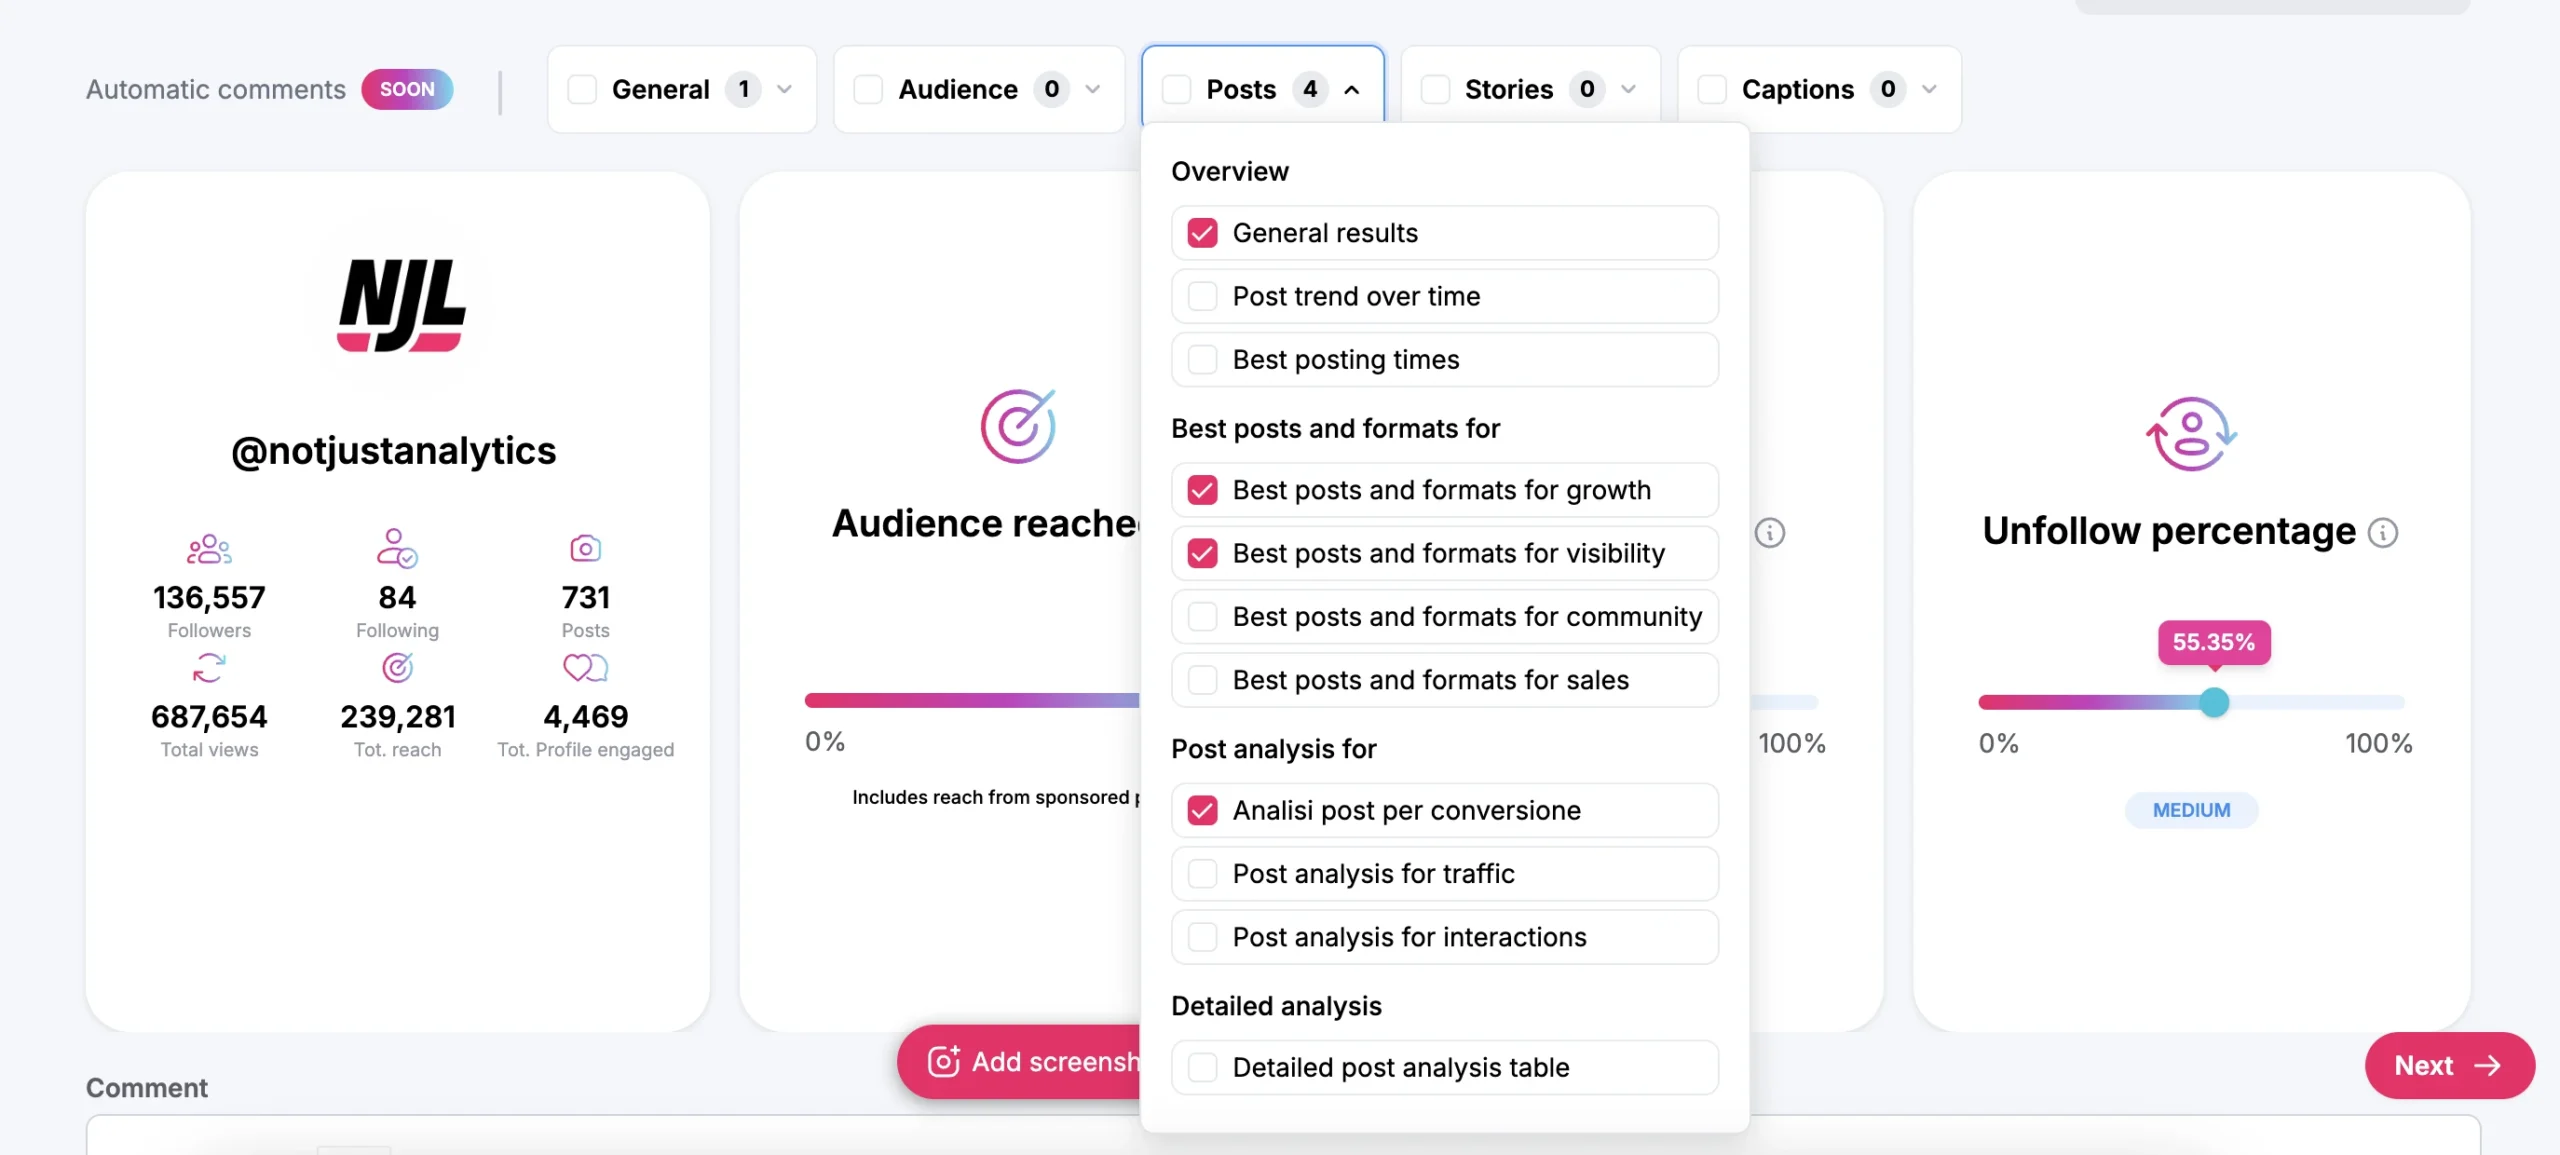
After selecting your profile and date range, you can customize the report according to your needs.
Depending on your subscription, the following configuration options may be available:
✔️ choose which charts to include in the report.
✔️ add comments to highlight insights and observations.
✔️ include screenshots to support your analysis with visual examples.
✔️ insert text slides for deeper explanations or extra details.
Once you’ve set up the report to your liking, you can finalize and send it.
4️⃣ Send the report
When you’re done configuring, it’s time to send the report.
- Enter the required delivery details: the email address(es) of the recipient(s).
- (Optional) Set a password to protect the report if you want to limit who can access it.
Click ’Create Report’ to generate it.
📌 Where will you find your report?
The report will be sent by email and will also be available in the Report History section within the Reports feature.
5️⃣ Managing drafts and incomplete reports
Did you stop midway while creating a report? Don’t worry—you can pick it back up in Drafts!
- Go to the Drafts section to see all unfinished reports.
- Select the report you want to resume.
- Click ’Complete Creation’ to continue where you left off.
📌 What if the report takes time to generate?
If the report contains a lot of data, it may take a few minutes to process. As soon as it’s ready, you’ll find it in the Draftssection and receive a notification.
Conclusion
Now you know how to create and manage reports in Not Just Analytics!
✅ Generate custom reports to monitor growth and performance of your Instagram profile.
✅ Add charts, comments, and custom slides to make your report clearer and more helpful.
✅ Schedule reports automatically and share them easily with your team or clients.
💡 Need more help?
Feel free to explore other tutorials available on the platform, and if you have any questions or issues, contact our support team.