What’s new in Not Just Analytics?
The NJL team has been working on updating the latest data provided by Instagram’s official APIs!
General business data analysis
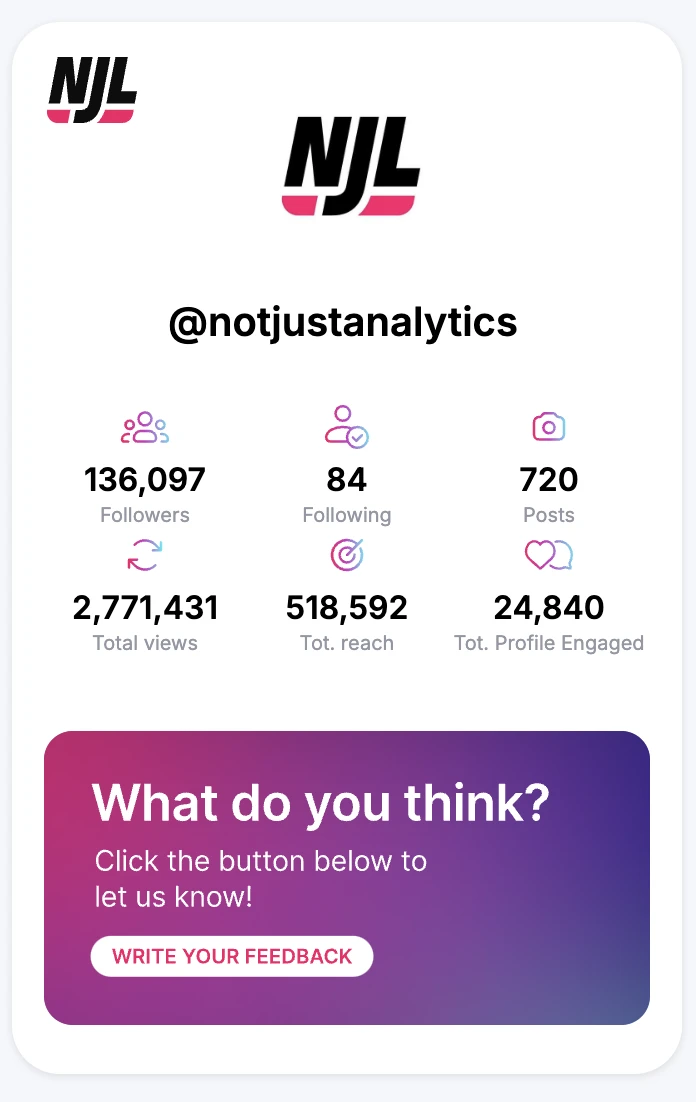
Along with previous updates, we’ve introduced new key metrics in your profile’s main data overview:
✅ “Views”
This new metric, introduced by Instagram, replaces Impressions, which will be discontinued starting April 21, 2025.
✅ “Average Views per User”
Shows how many times, on average, the same person views your content (Posts, Reels, and Stories).
⭐️ “Total Engaged Profiles”
A brand-new metric that displays the total number of people who interacted with your content during the selected period.
Instagram Stories business data analysis
The Stories analytics section has been completely revamped, enhancing the quality of insights and, most importantly, the actionable recommendations available on NJL to help you optimize your Instagram Stories performance. Here are the key updates:
⭐️ Total Actions
A new metric that tracks the total number of interactions, link clicks in bio, and shares generated by all Stories published within the selected period. This is a valuable indicator to measure the effectiveness of your communication and showcase its impact to others.

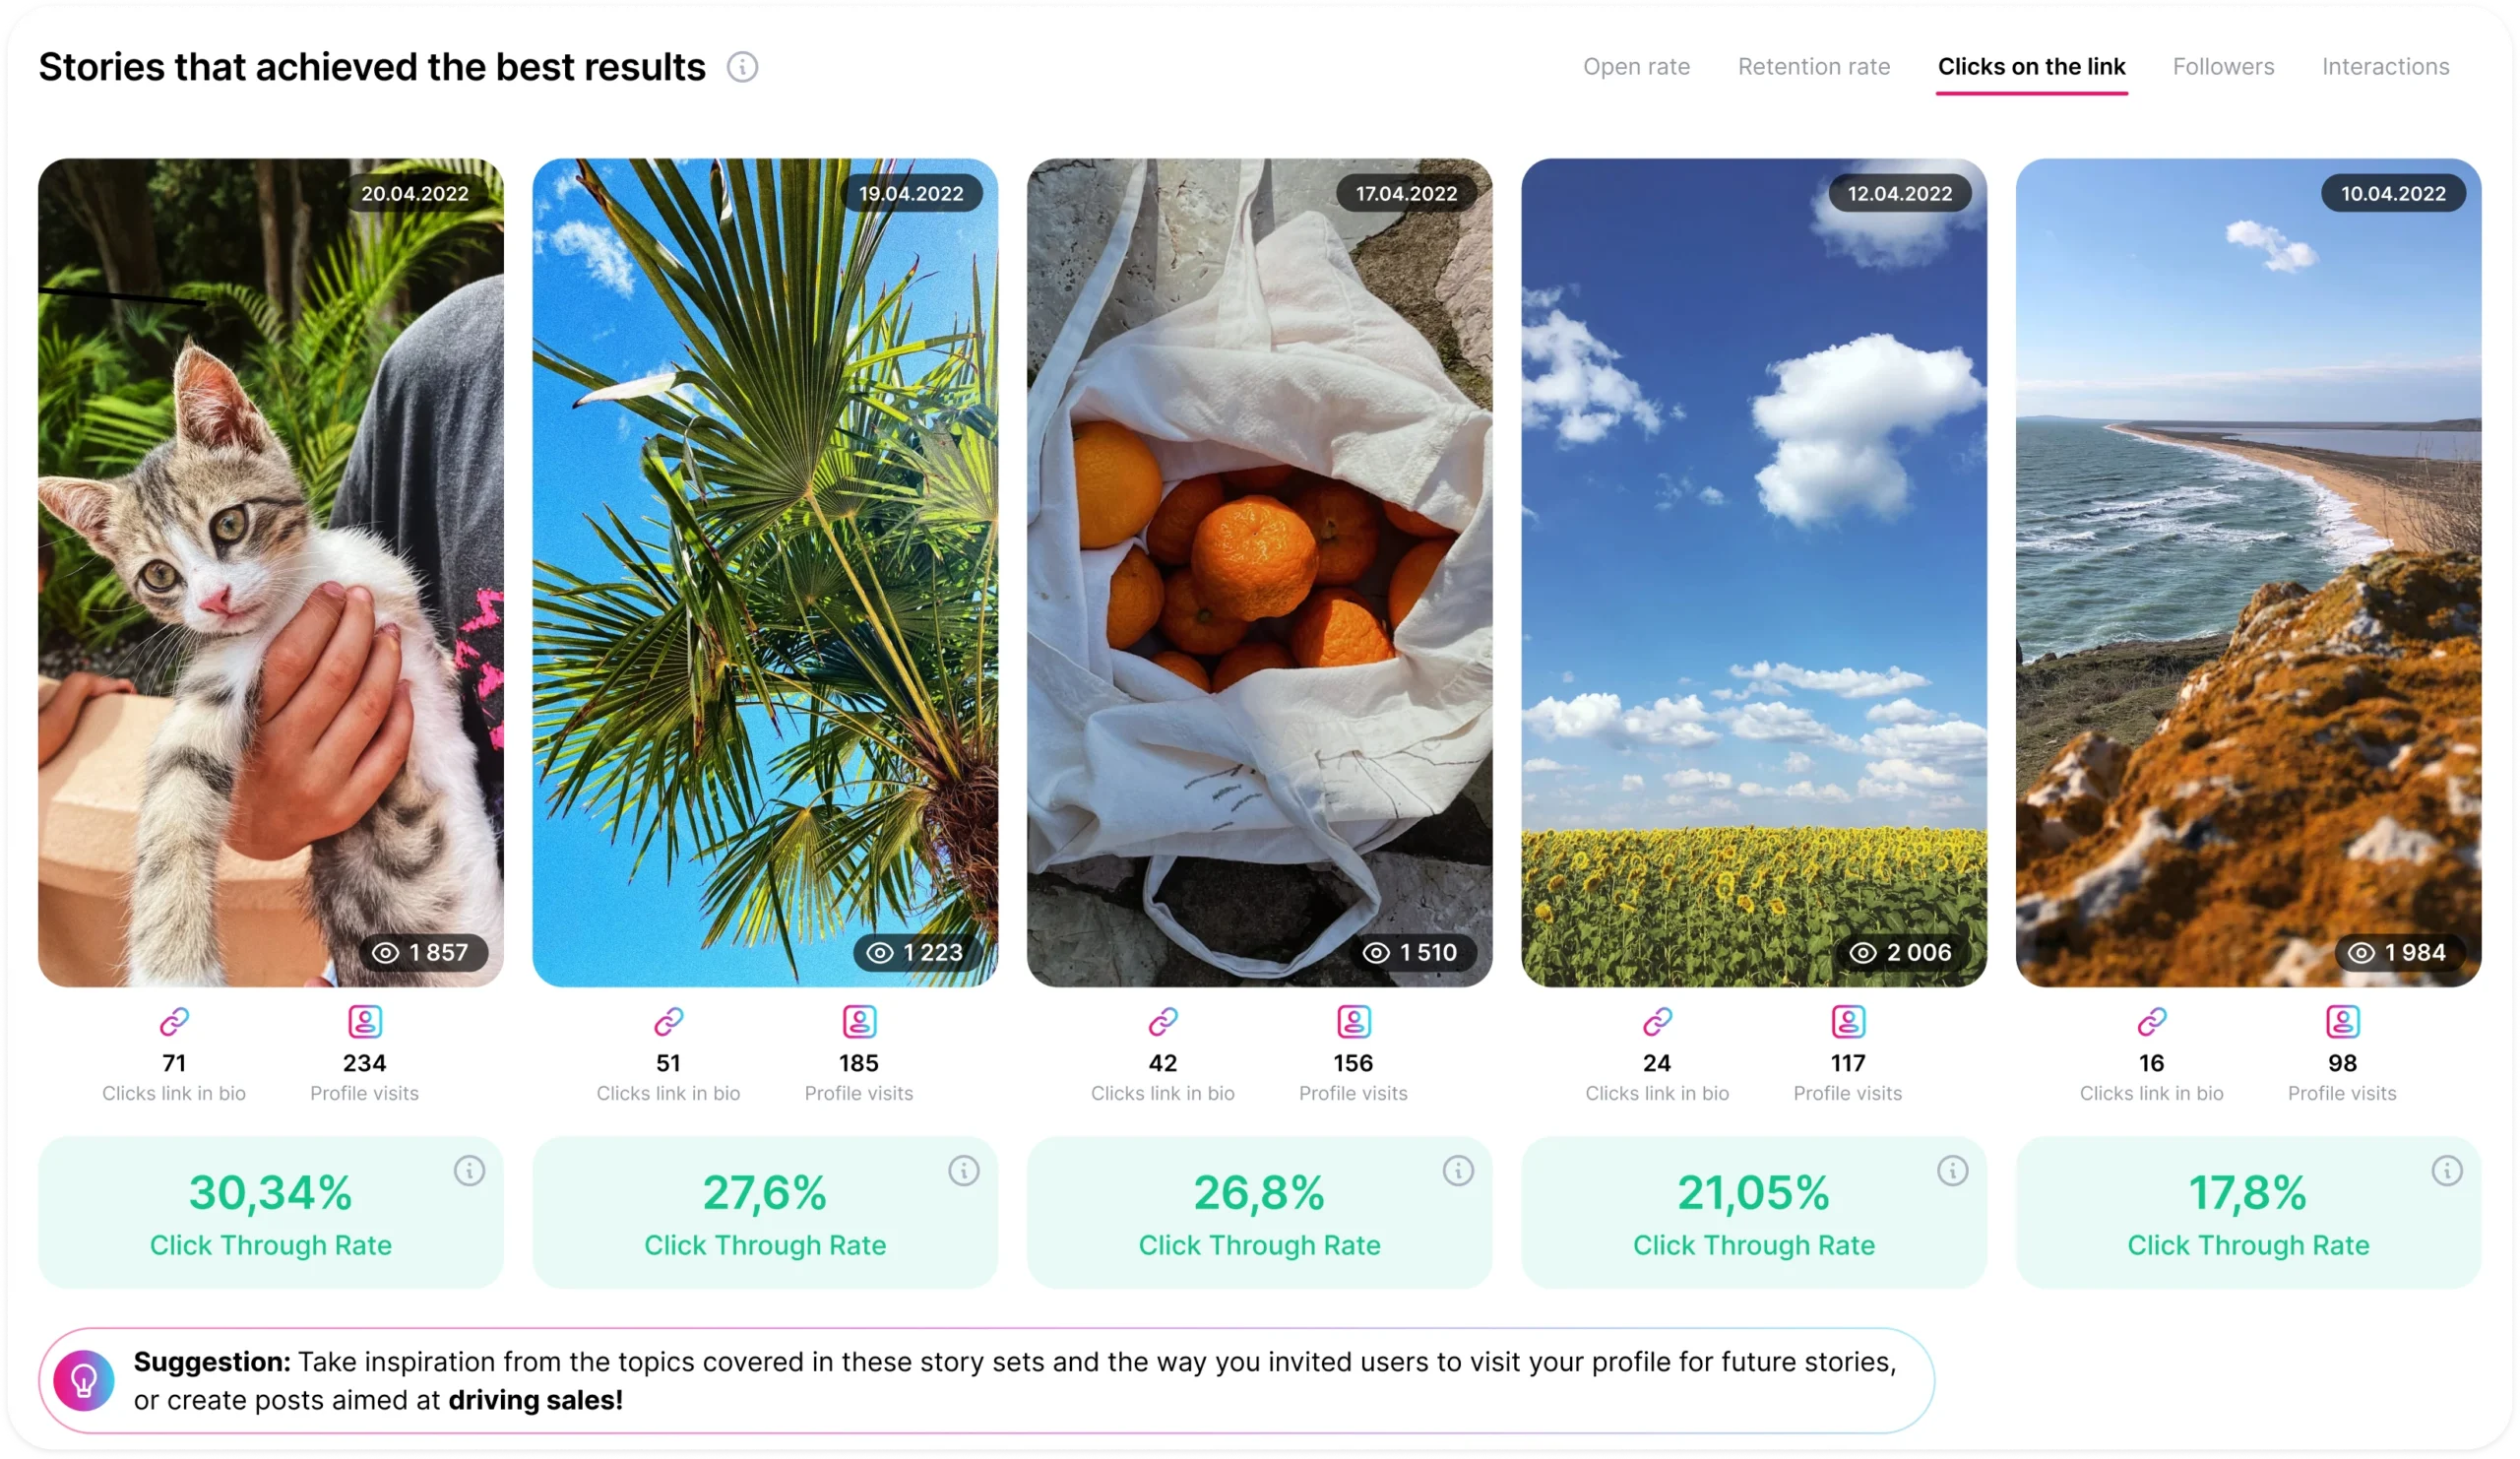
⭐️ We’ve introduced three new filters to help you identify your best-performing Stories based on key engagement metrics:
- Follower Conversion – Highlights the Stories that generated the highest number of new followers. Analyze these Stories to create posts that boost your profile growth!
- Click-Through Rate (CTR) – Shows the Stories with the best performance in terms of link clicks in bio. Use these insights to develop content that drives more conversions!
- Interactions – Collects the Stories with the highest engagement, including likes, shares, and new followers. Get inspired by these Stories to create content that strengthens your community engagement!
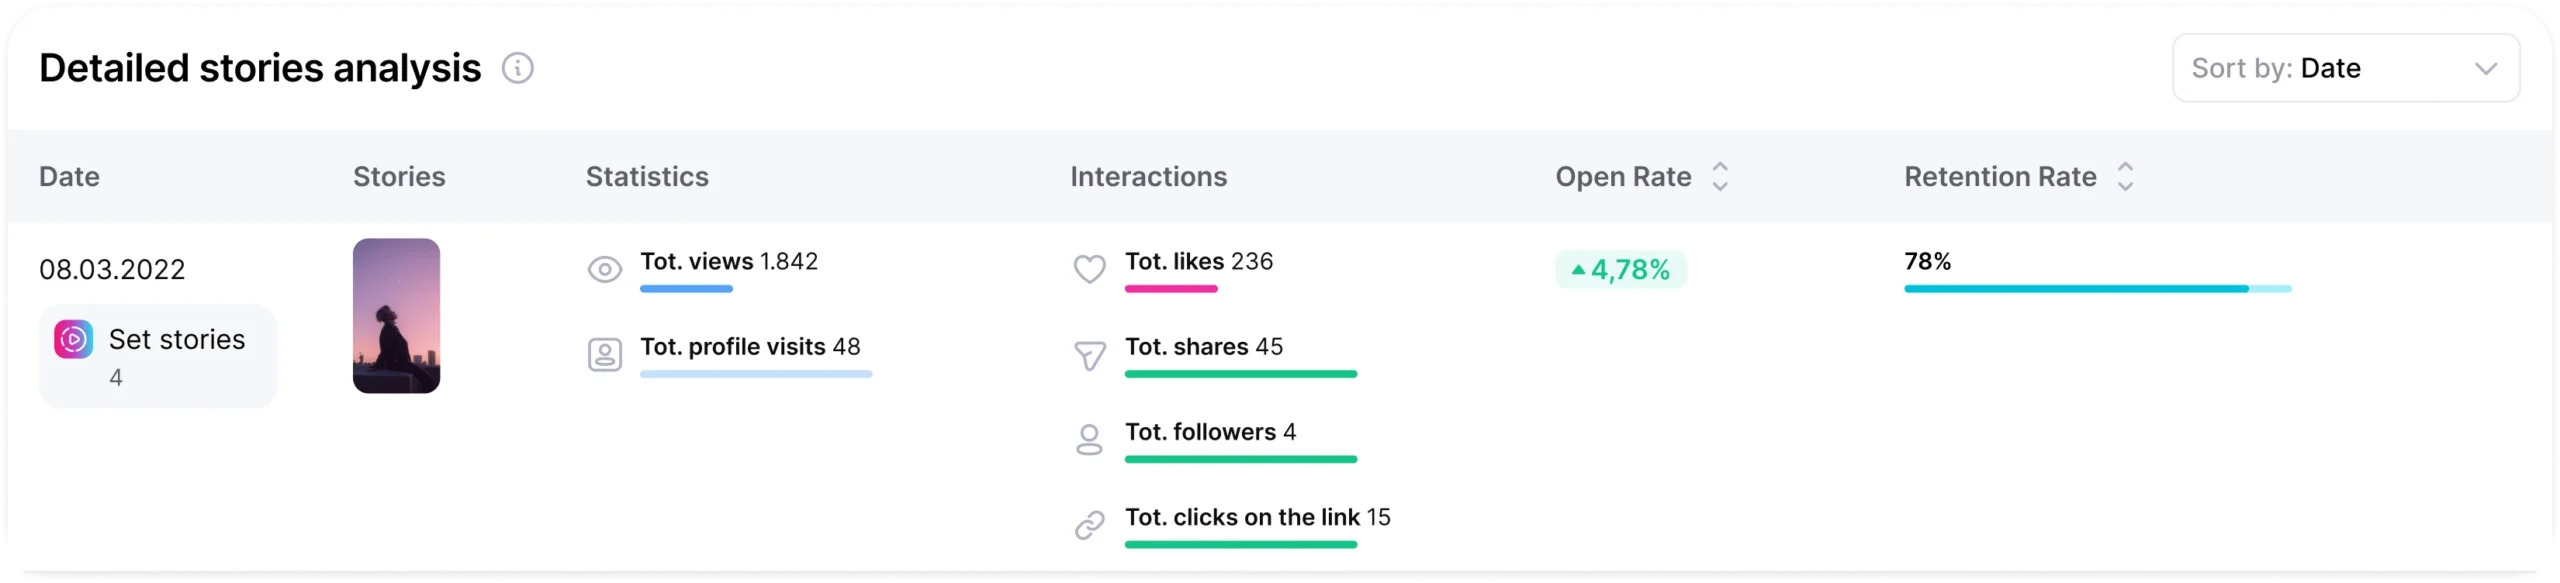
⭐️ Detailed data for individual stories & daily sets
You can now track key metrics such as Shares, Interactions, New Followers, Link Clicks, and Profile Visits both for each individual Story and for the entire set of Stories published on the same day. This feature helps you easily identify the topics that generated the most profile visits or the highest engagement with your followers.
✅ Total Views
The summary card now includes the total number of views generated by your Stories within the selected period, giving you a more complete performance overview.
✅ Open Rate Trend
The previous Open Rate trend chart has been removed, but the same insights are now presented in a clearer, more accessible format:
- The Open Rate trend line has been integrated into the “General stories performance” chart, with distinct colors: green for positive growth and red for a decline.
- The Open Rate improvement percentage from the last 7 days is now available in the Stories Averages section.
These updates are now live for all Not Just Analytics subscriptions.
Log in to analyze your Stories performance, or click here to sign up for NJL!
Onboarding refactoring: a smoother start!
We’ve completed the refactoring of the onboarding sequence, optimizing it for both desktop and mobile. Our goal? To ensure that new NJL users can navigate the platform effortlessly from their very first login! 🚀
What we’re working on
✅ Artificial Intelligence (AI) – The Beta version of NJL’s AI is almost here! (And we might have found a more exciting name for it 😉). Initially, access will be exclusive to NJL subscribers.
Release date: February 24
The NJL Team
🫦 Making data sexy since 2018