One reason your content may not be getting the desired results could be that you’re not speaking to the right audience. Have you ever wondered if the followers of your profile are the same audience who see your content? And further, is the audience who sees your content the same as those who interact with it?
Having the answers to these questions could make a big difference in your communication and help you achieve the results you’ve been working hard for. Not sure where to start to find this information? Now we’ll show you how you can get the answers to these questions through Instagram audience analysis with Not Just Analytics!
Detailed Instagram audience analysis
All’interno di Not Just Analytics abbiamo rilasciato una nuova sezione: l’analisi dell’Audience. Questa funzione ti permette di analizzare in modo approfondito la distribuzione per genere, età e geolocalizzazione dei tuoi follower, nonché del pubblico che raggiungi e coinvolgi con i tuoi contenuti.
At Not Just Analytics, we’ve released a new section: Audience Analysis. This feature allows you to thoroughly analyze the distribution by gender, age, and geolocation of your followers, as well as the audience you reach and engage with your content.
This analysis helps you understand if you are reaching the right audience and if your strategy is effective. To help you determine if you’re moving in the right direction, analyze not only who follows you but also the reach of your posts and interactions. The data to check includes:
- Follower personas: The profile of the people who decided to follow you.
- Reached personas: The profile of the people who are shown your content.
- Engaged personas: The profile of the people who, after seeing your content, decide to interact.
If all three personas are similar, it means your communication is aligned and consistent, making it easier to achieve results! If they don’t match, don’t worry; by the end of this article, you’ll know what to do!
Boomer vs. Nerd
To meet the diverse needs of our users, we’ve introduced two modes for explaining the data: Boomer and Nerd. This type of visualization is available for all data analyzed with Not Just Analytics. Let’s see specifically how these two modes apply to your Instagram audience analysis.
Boomer Mode: Simple and Intuitive
Boomer mode is designed for those who need quick answers or are not very data-savvy and need the information to be easy to read, interpret, and ready to use. In the Audience Analysis function, in this mode, you can see at a glance:
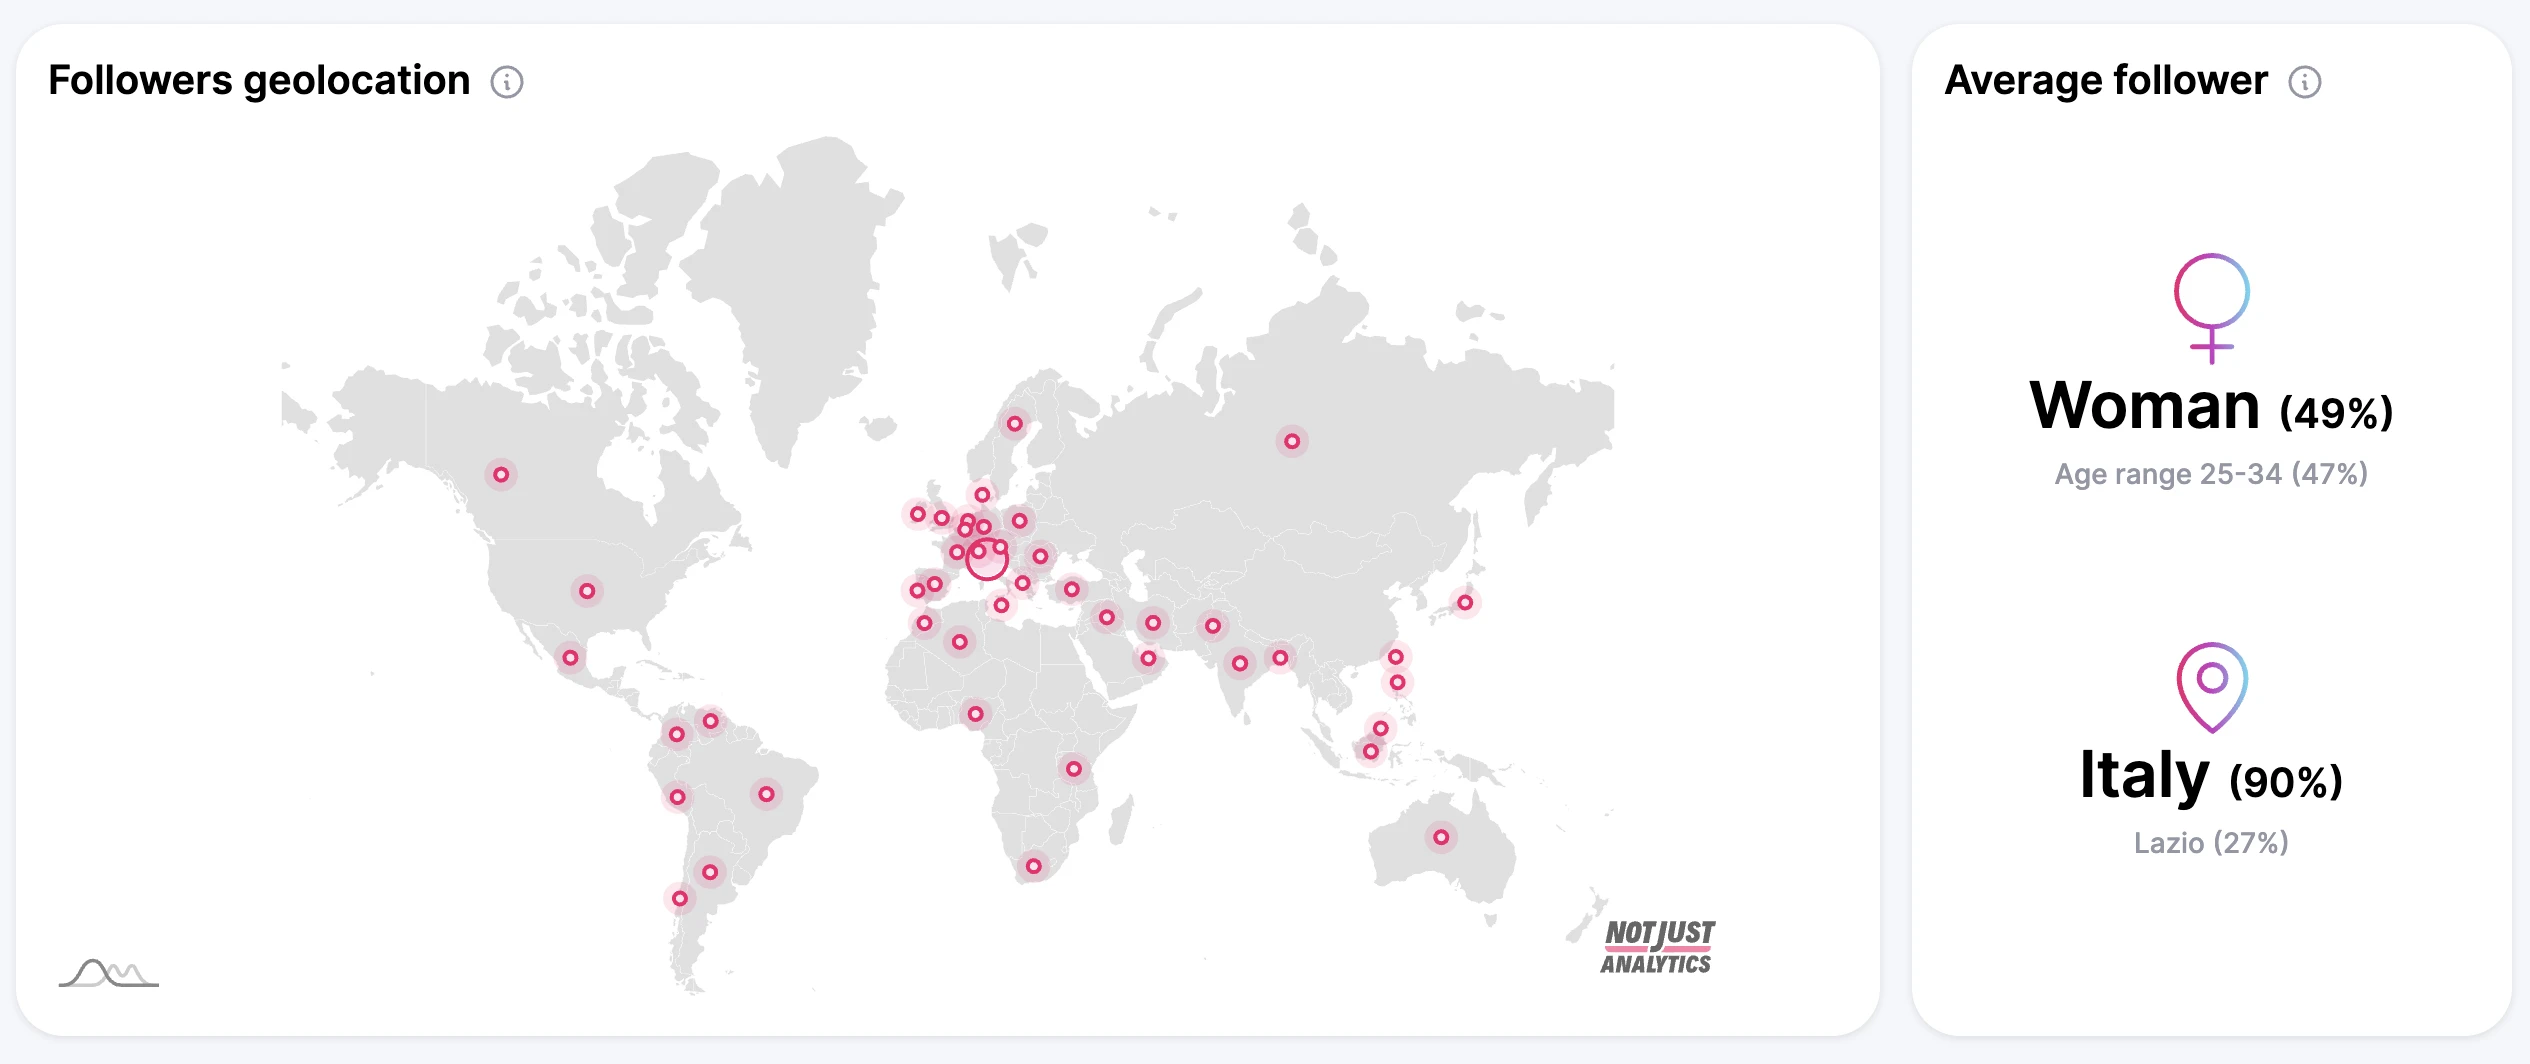
- Follower Geolocation: The geographic distribution map of your followers, highlighting the main regions and countries where your audience is concentrated.
- Average Follower: Demographic information about your typical follower, including the predominant gender and the most represented age group.
Now that you know where your followers are from, it’s time to understand if they are the same ones who see and interact with your content.
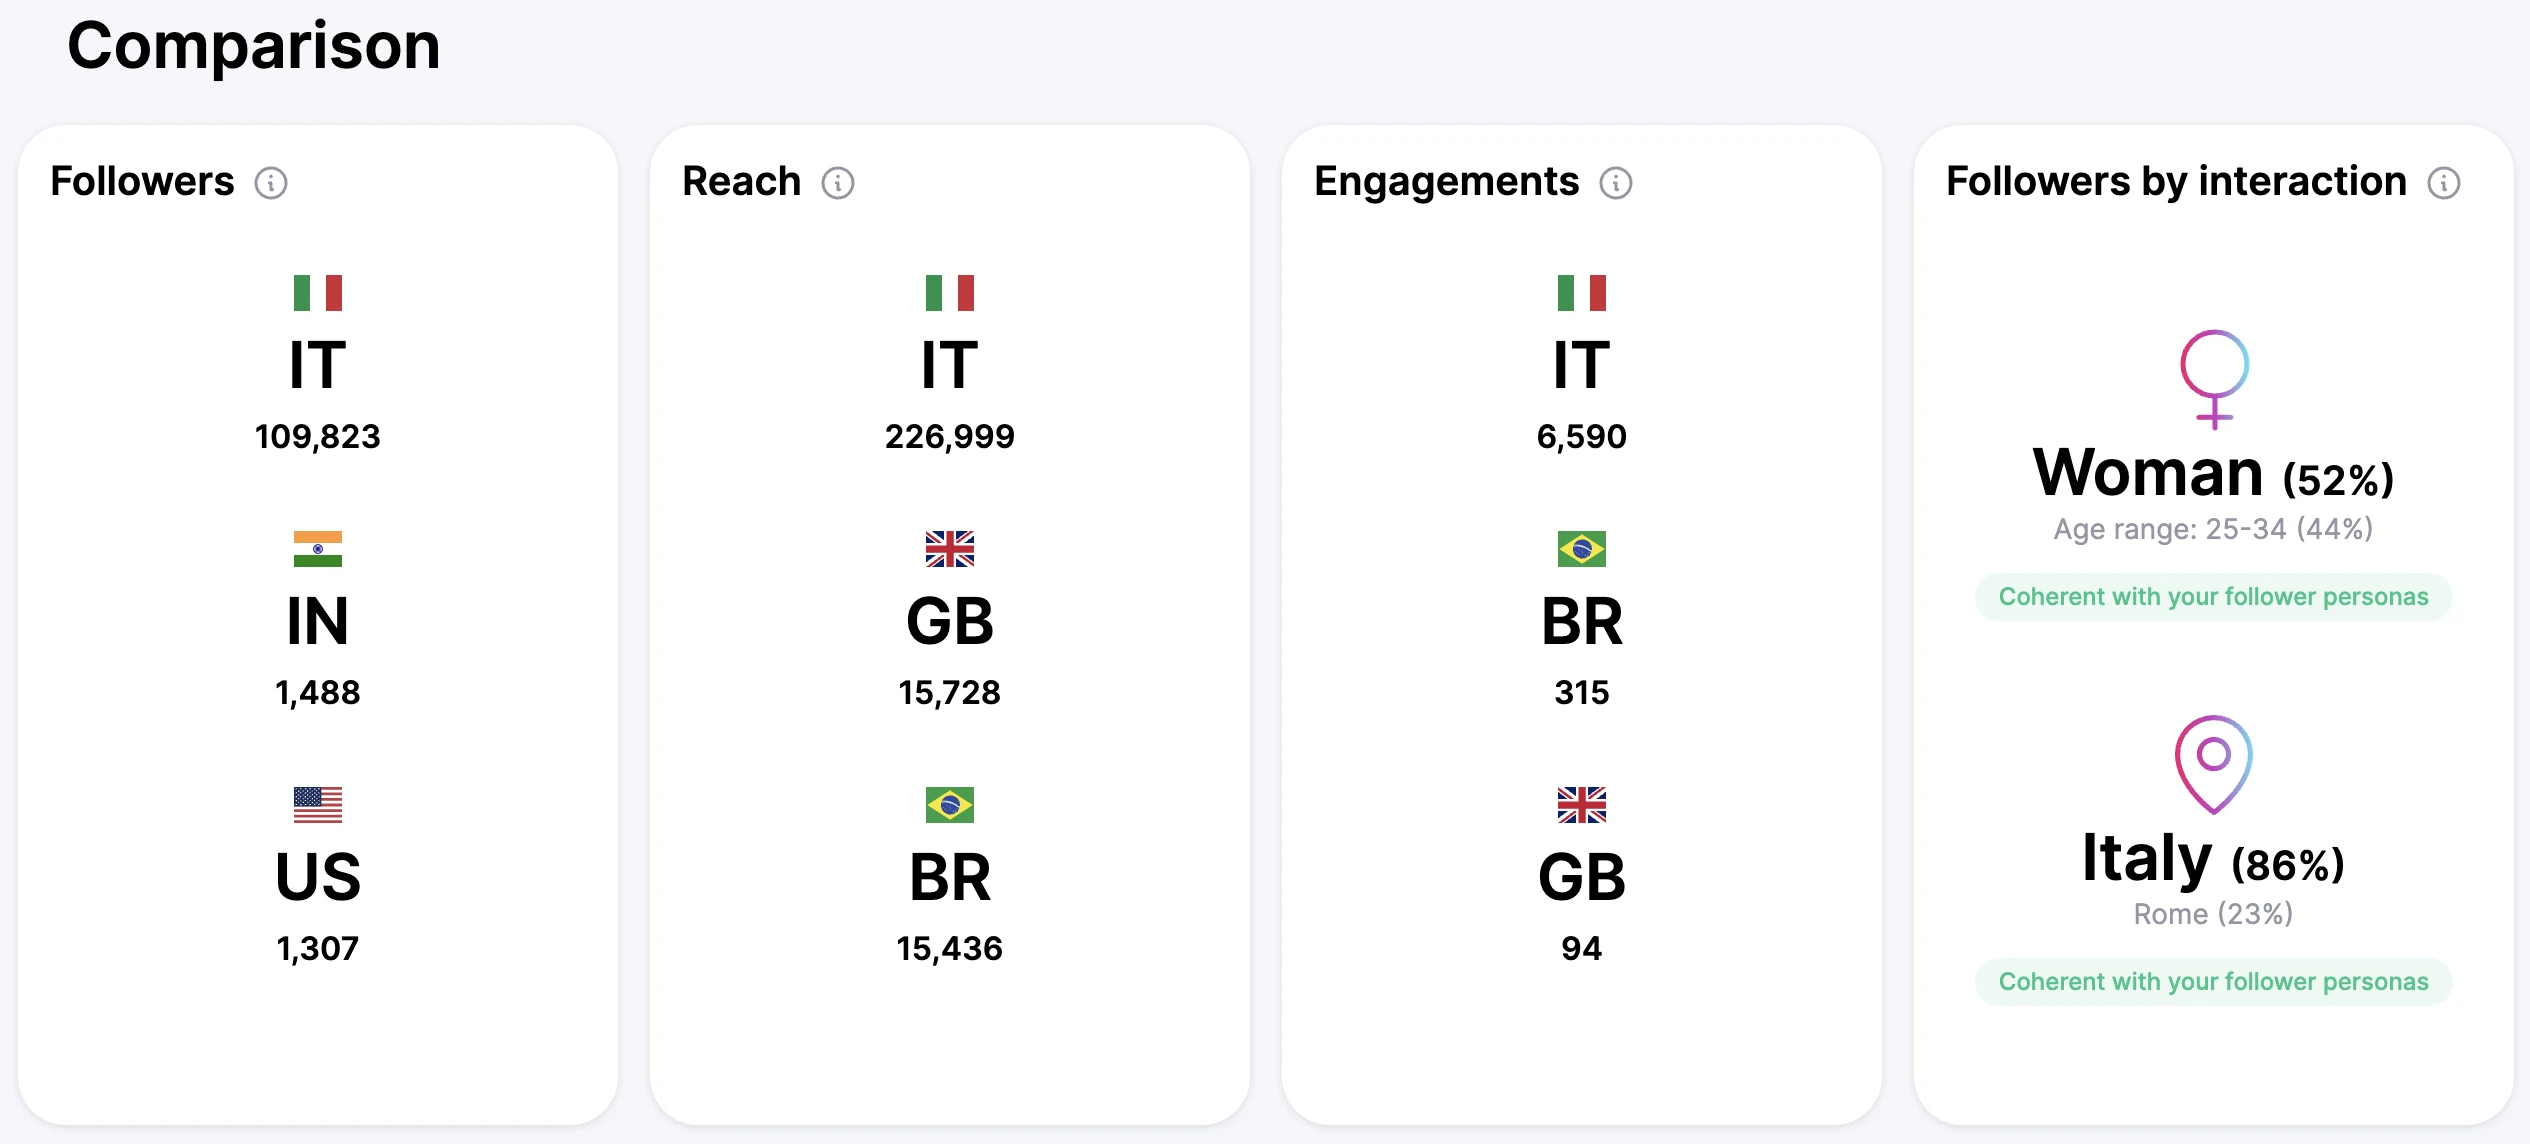
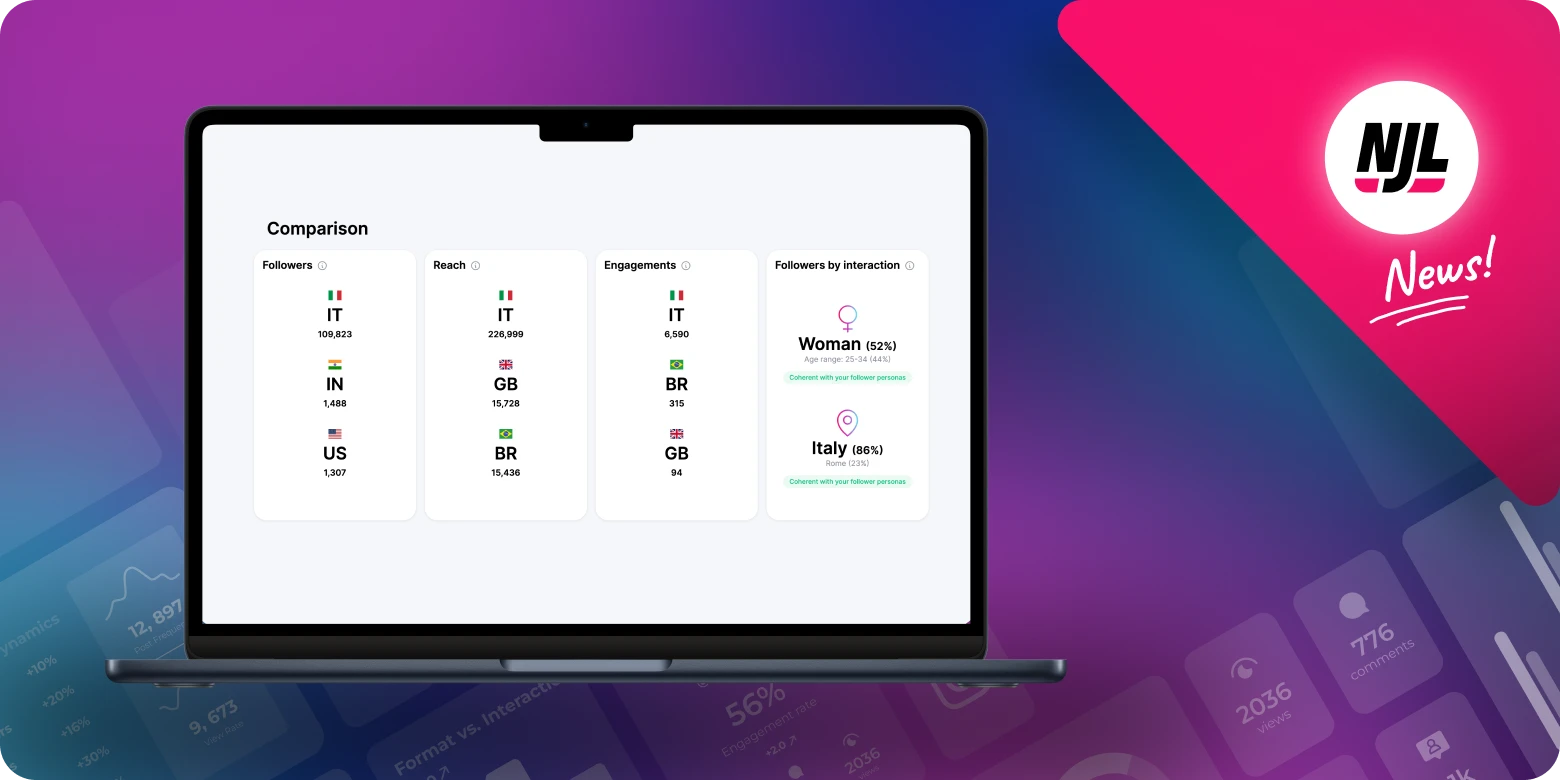
Interpreting the data is very simple: Boomer mode allows you to compare the top three countries for followers, reach, and interactions. This way, you can quickly see if something is off. Finally, just look at the messages in the “Followers by Interaction” section to know if the audience interacting and viewing your content is consistent with your typical follower. It’s all very intuitive: “green” means you’re okay, “yellow” means there’s something to fix, and “red” means urgent intervention is needed. This also helps you understand if you’re missing something when creating content.
Nerd Mode: detailed insights
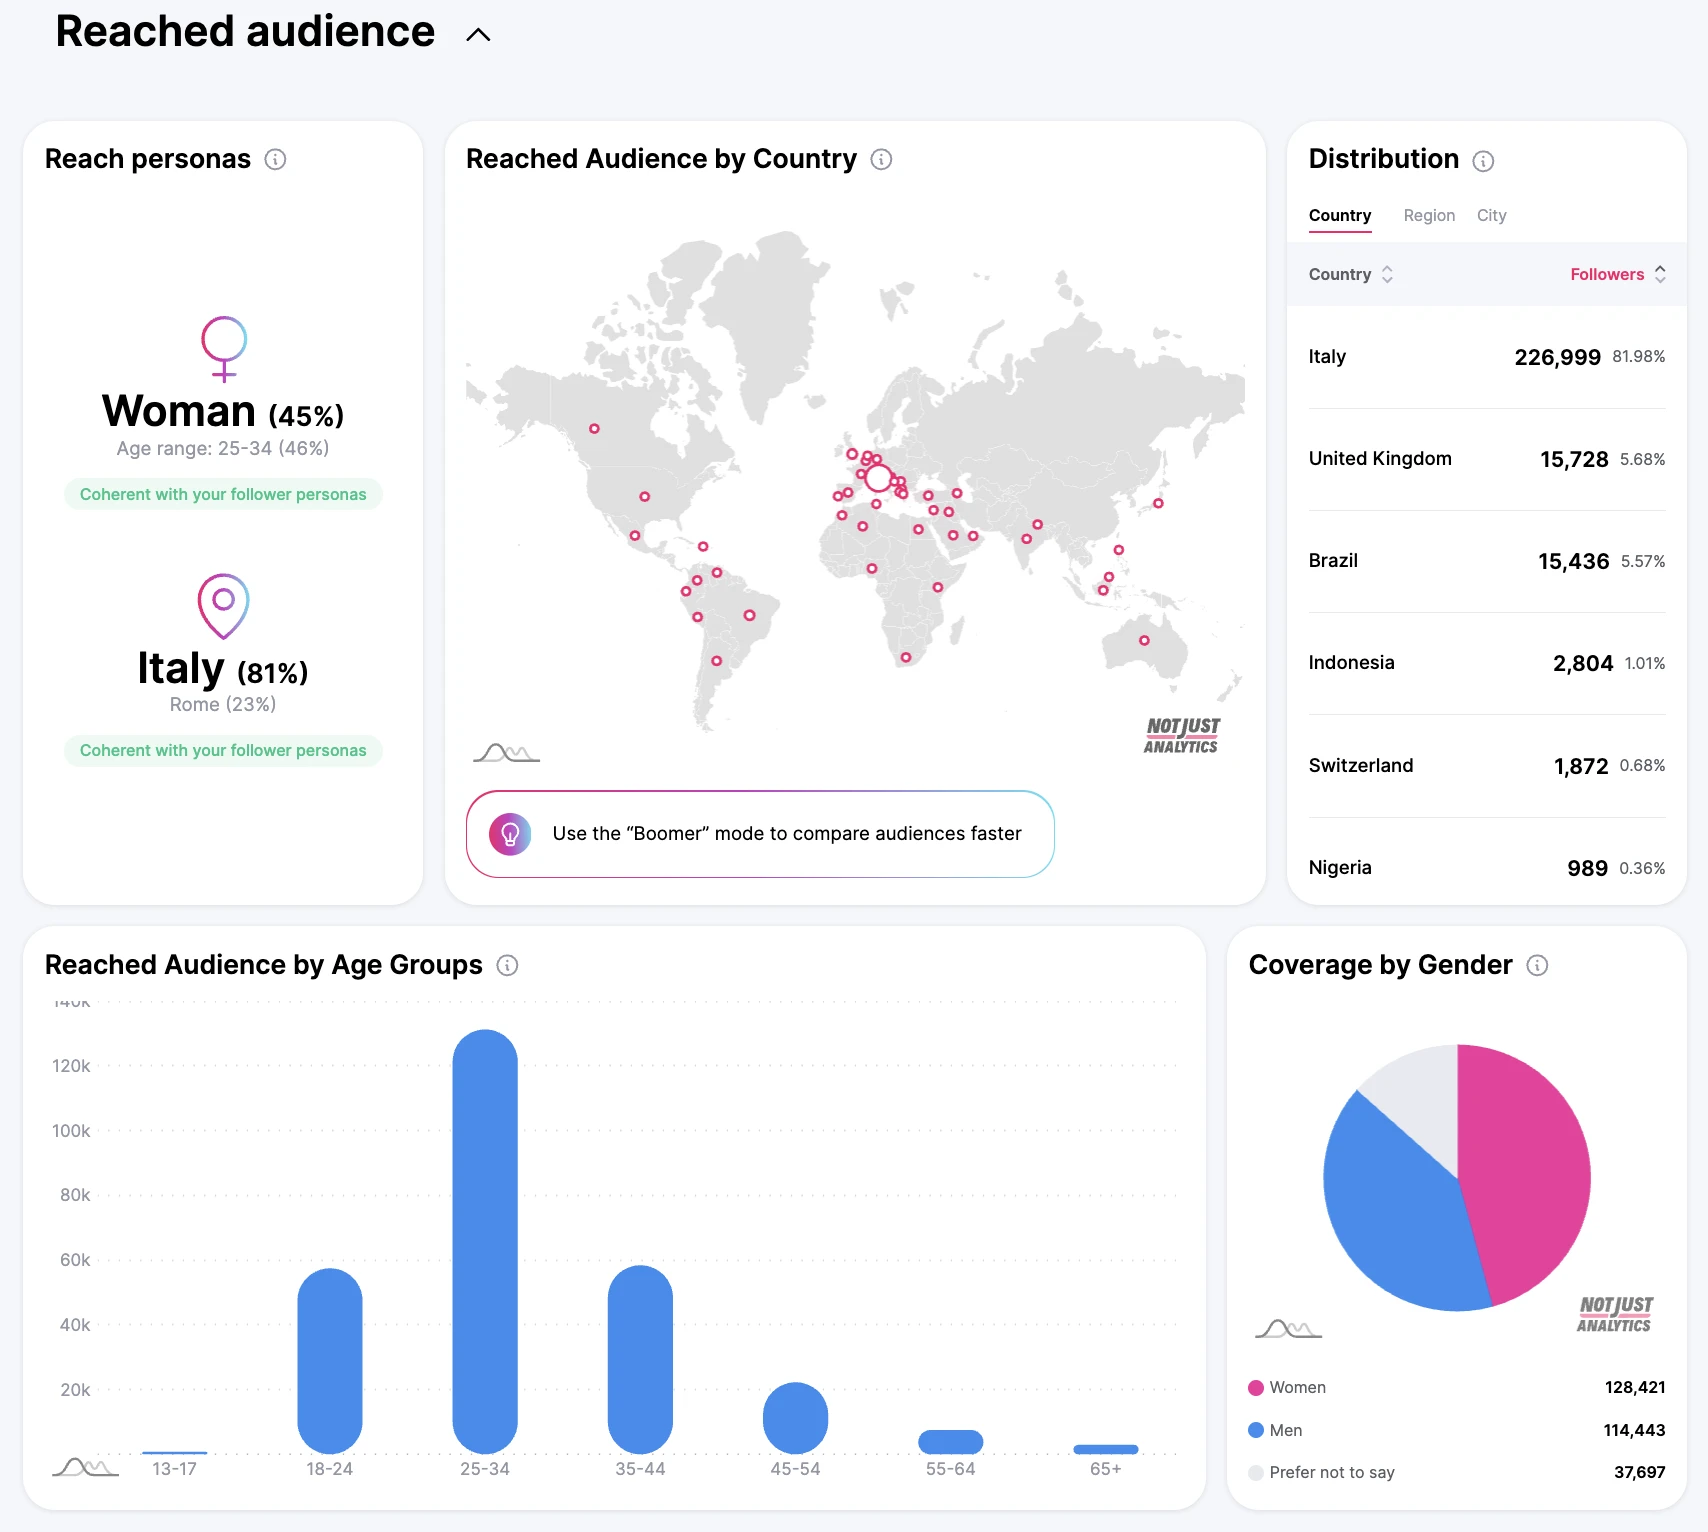
For those who want a more in-depth analysis, Nerd mode allows you to thoroughly analyze the involved personas, the demographic distribution by gender and age, and the geolocation of the audience reached and engaged. You can see all the countries, regions, and cities your followers come from, know all age groups, and the percentage of gender identification.
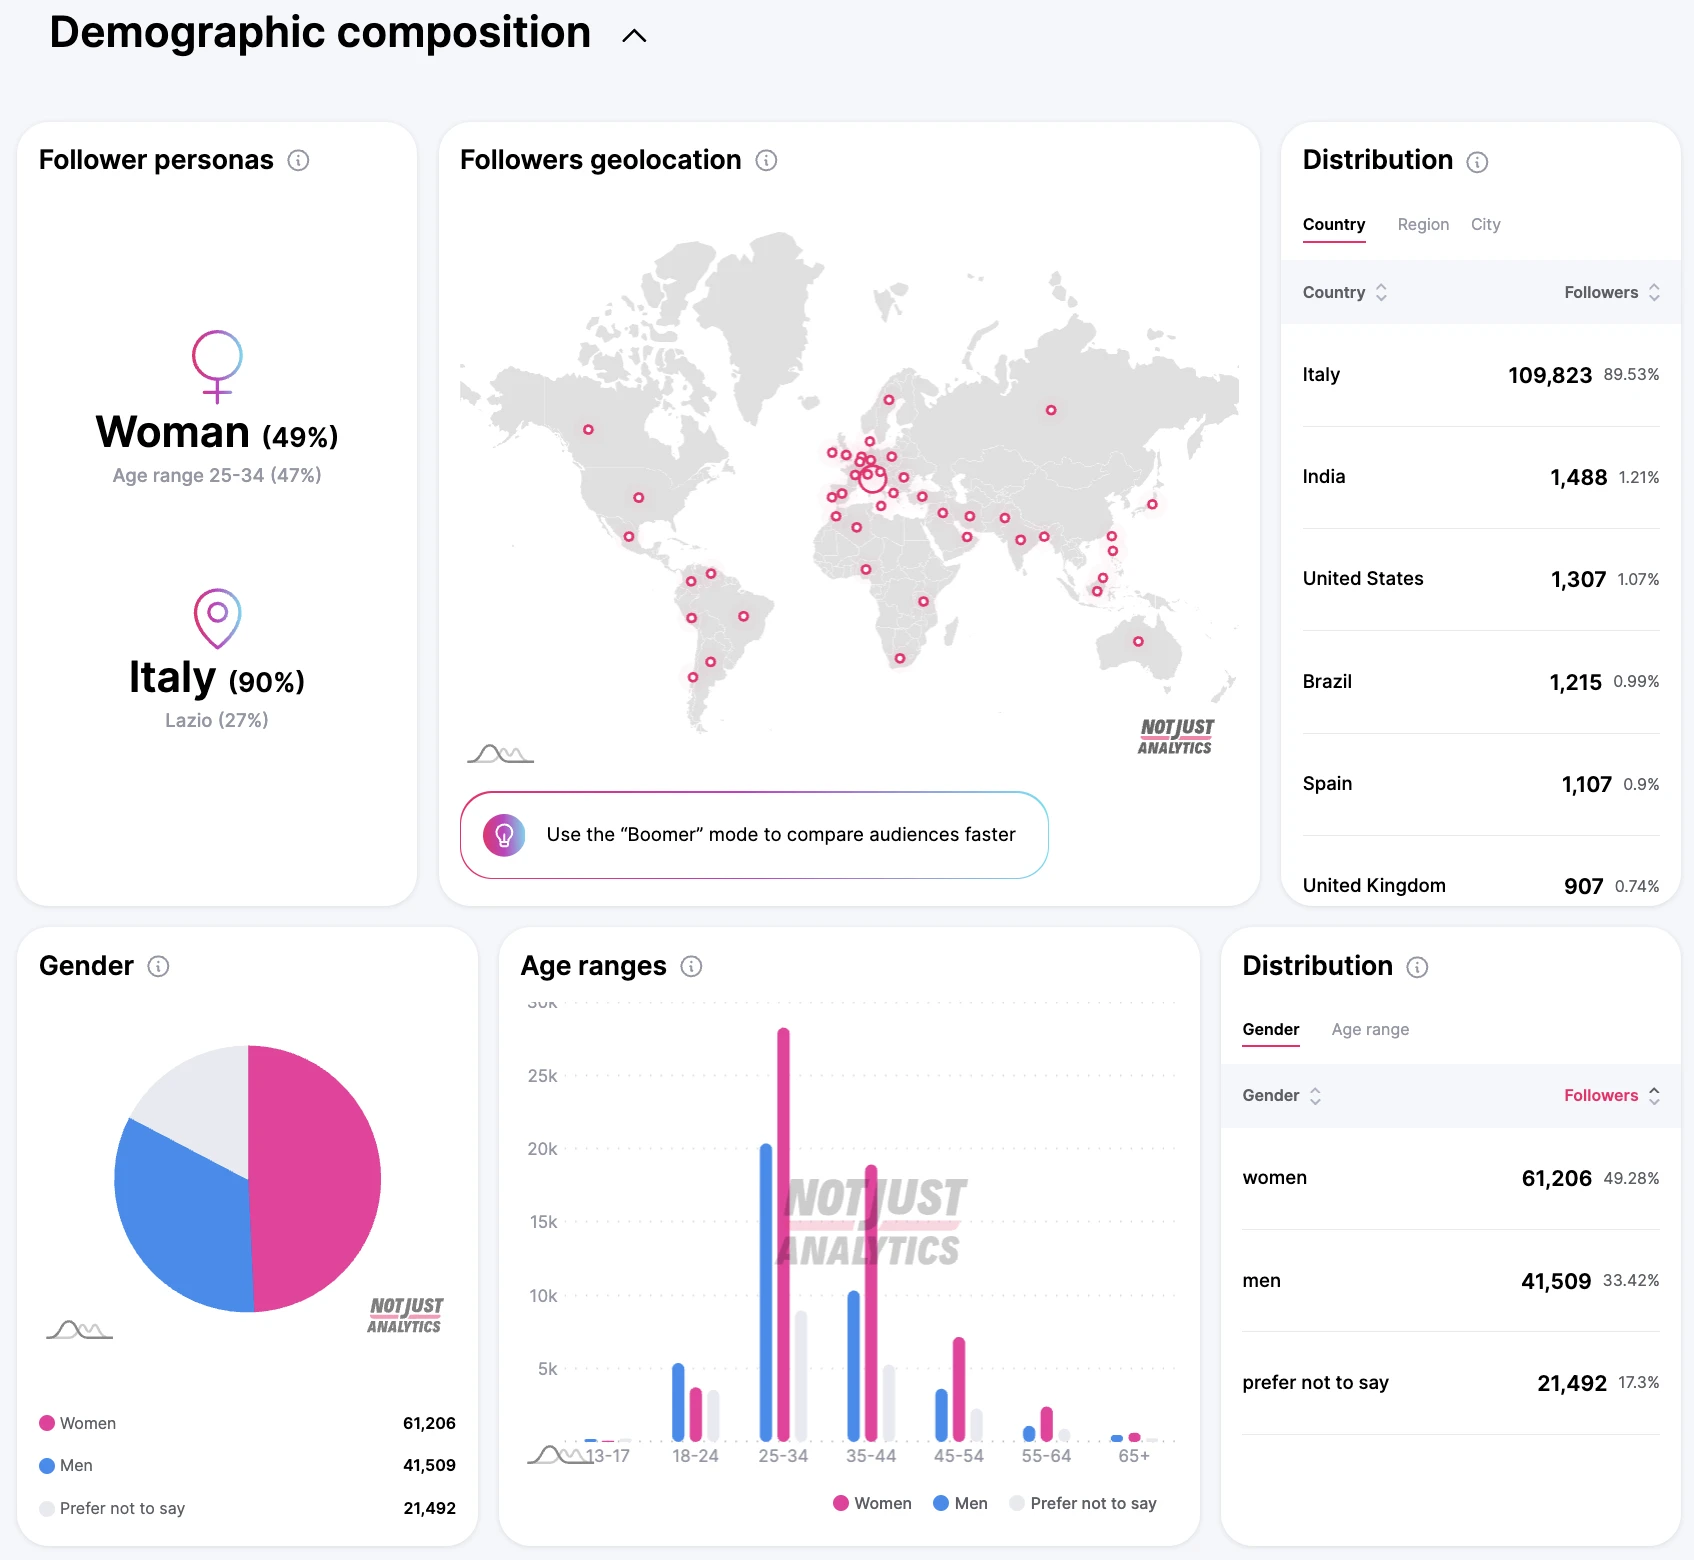
This level of detailed information is available not only for your followers but also for the audience you reach and the audience that engages with your content. With Nerd mode, you’ll have not just a profile, but a complete overview. This will allow you to understand which group of people follows and interacts with your content the most, as well as identify other potential target audiences.
Understand data in Instagram audience analysis
Reading the data is simple; they are just numbers. The real question is: what useful information can I derive from this data, and what should I do after reading it?
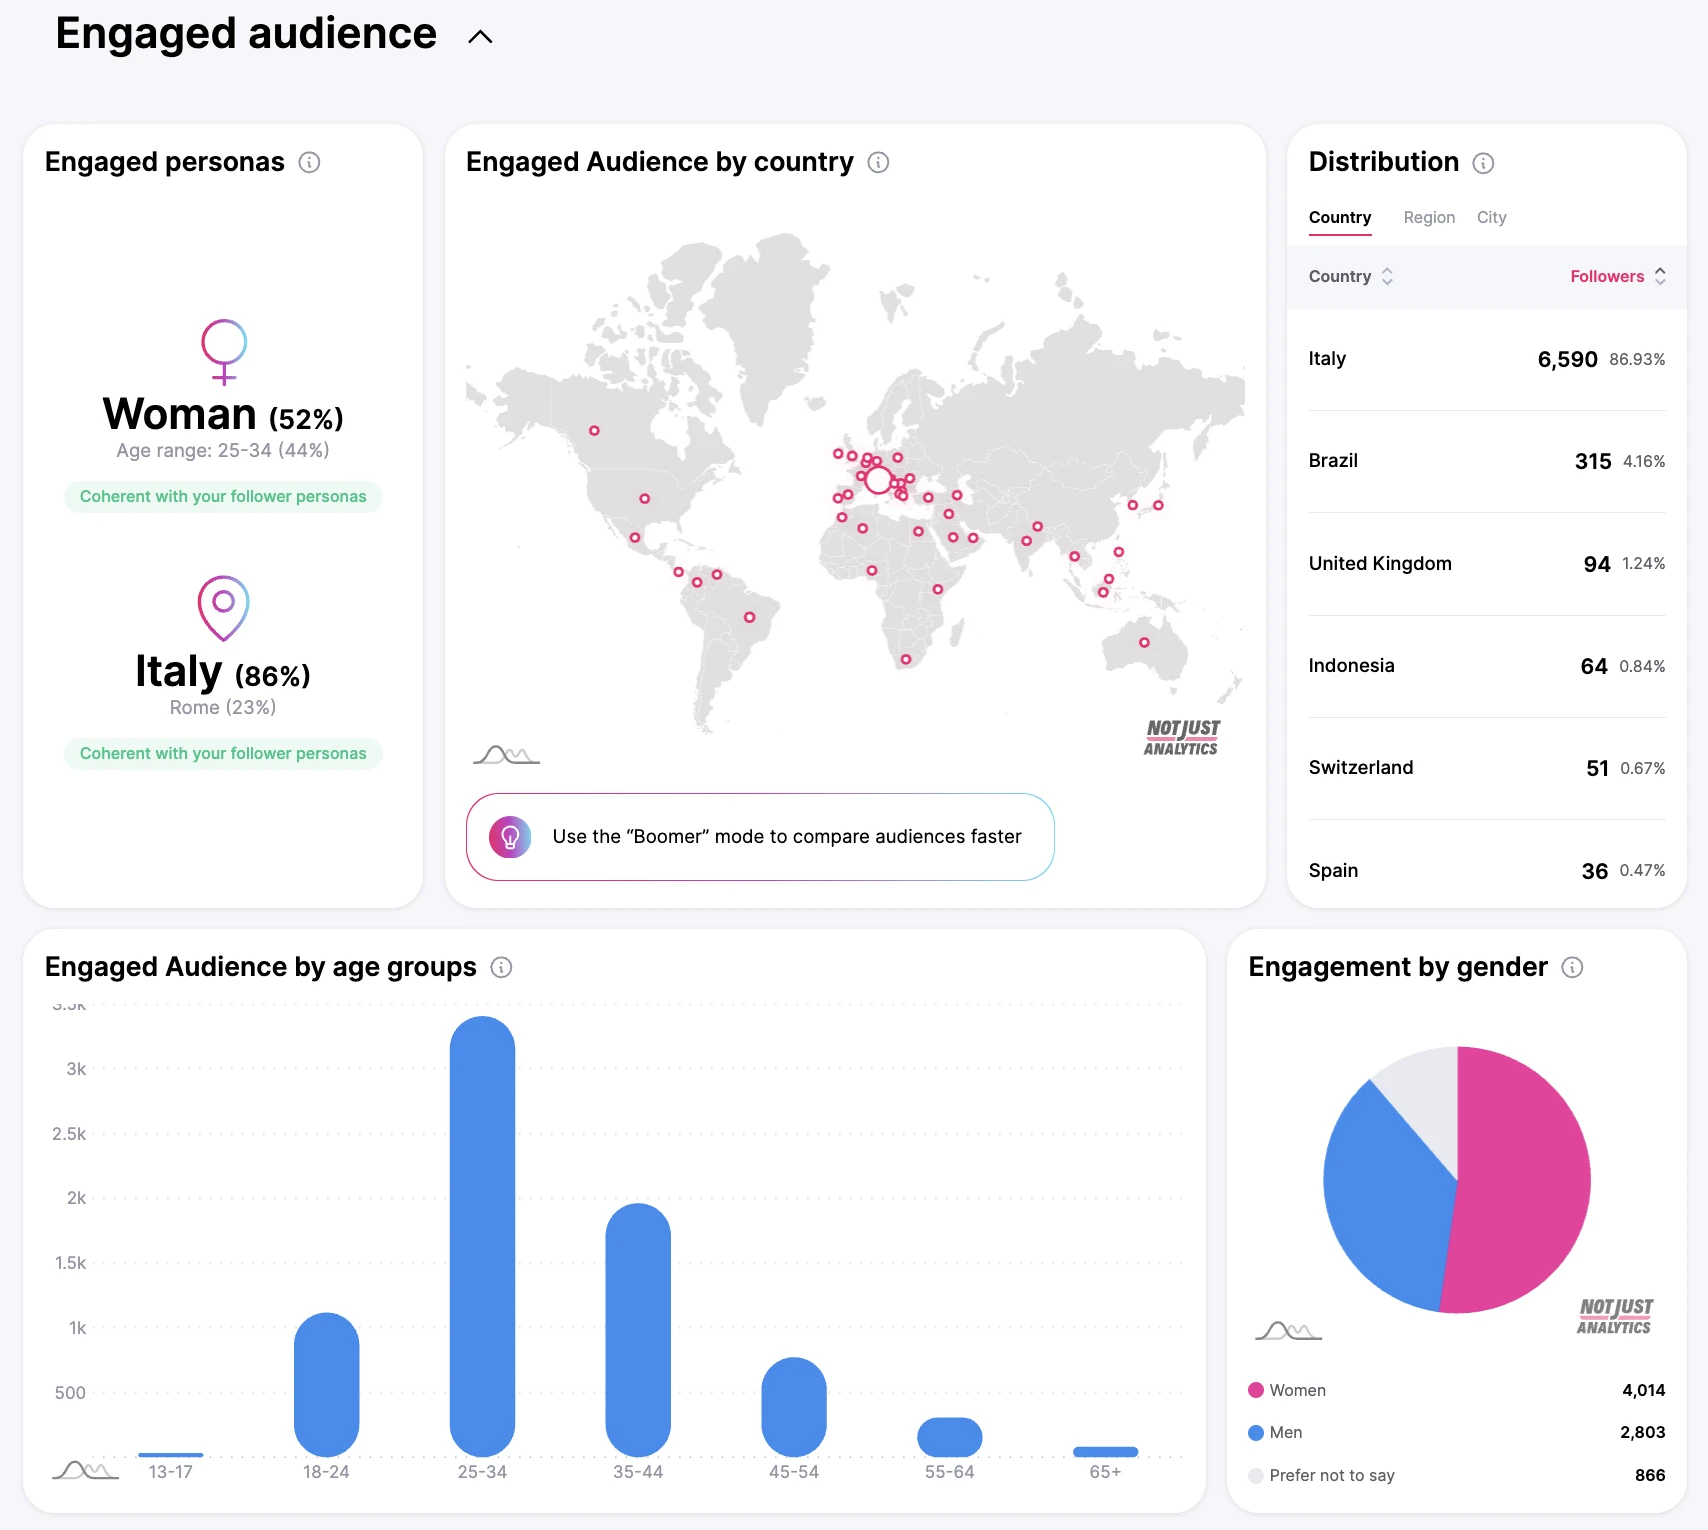
At the beginning of the article, we talked about the three personas analyzed within audience analysis. We also said that if these three personas match, your communication is consistent. But what happens when they differ? To simplify the analysis, we’ve added a function that automatically compares followers, reach, and interactions: this way, you know if they match or not (within the graph above, it’s the text in green).
- If your reached audience is different from your follower personas: Your content is viewed by people who do not match those who currently follow you. If this is intentional and reflects an increase in new followers, then you’re on the right track. If not, this could be why you’re not growing as expected.
- If the engaged audience is different from your follower personas: This could indicate that your communication style is evolving and attracting a new audience, different from those who follow you. If this change is intentional, it’s a positive sign. If not, this may explain why your posts receive fewer interactions: you’re not creating content that resonates with your usual audience.
Conclusion
Understanding who follows, views, and interacts with your content is essential to aligning your strategy and maximizing the effectiveness of your actions. At Not Just Analytics, we’ve put all our experience into Boomer and Nerd modes to simplify your work and help you have a clear and detailed view of your audience.
This information can be invaluable not only for your online strategy but also for offline initiatives! For example, by analyzing the data from Not Just Analytics’ profile, we discover that many of the users who view and interact with our content are concentrated in Rome and Milan. This indicates that if we were considering organizing offline events, these two cities should be at the top of the list, as they host most of our active audience. Organizing an event in these areas would therefore increase the chances of significant participation.
Audience analysis is part of a series of new features we are introducing, thanks to new data released by Meta through official APIs. Our goal is to continue providing advanced tools that help you better understand Instagram dynamics and get the most out of your work. In this article, you can delve deeper into another important innovation: Coverage Distribution analysis!
NOTE: If you have an active subscription, you’ll find this function by opening the business analysis of your profiles and clicking on the Audience button right after the “General” data.
Want to try this function but haven’t activated Not Just Analytics yet? Click here to choose the subscription that suits you best, and remember that this feature is included in all plans!
Leave a Reply