Reasons behind our decision
NJL’s primary goal has never been to create a product, increase numbers, and then making an exit. There’s nothing wrong with that approach, but it’s not what we want for Not Just Analytics. Our mission has always been to develop a product with our community, grow together and strive to make a difference, even when this has meant making economically disadvantageous choices.
We understand that changes can be unsettling, especially when they involve features we’ve offered for free. Thus, we want to share the reasons for our decision:
- Cost management: the free version of NJL has always been the most expensive part of our infrastructure. With over 20 million profiles to analyze and data to store, ensuring high-quality information is increasingly costly.
- User segmentation: users of the free NJL are divided into two categories. Those who check Engagement Rate (E.R.) out of curiosity and those in the digital field seeking useful information. After six years of free usage, the latter group can continue their activities while contributing to NJL’s growth.
- Future investments: as NJL grows, so do our users. In the past two years, we have reinvested almost all our revenue to enhance the platform. We will continue on this path to expand our team and accelerate the development of new features, aiming to make significant improvements across the industry (to this end, we’ve created a function to verify data from Creators and Influencers).
What changes for you?
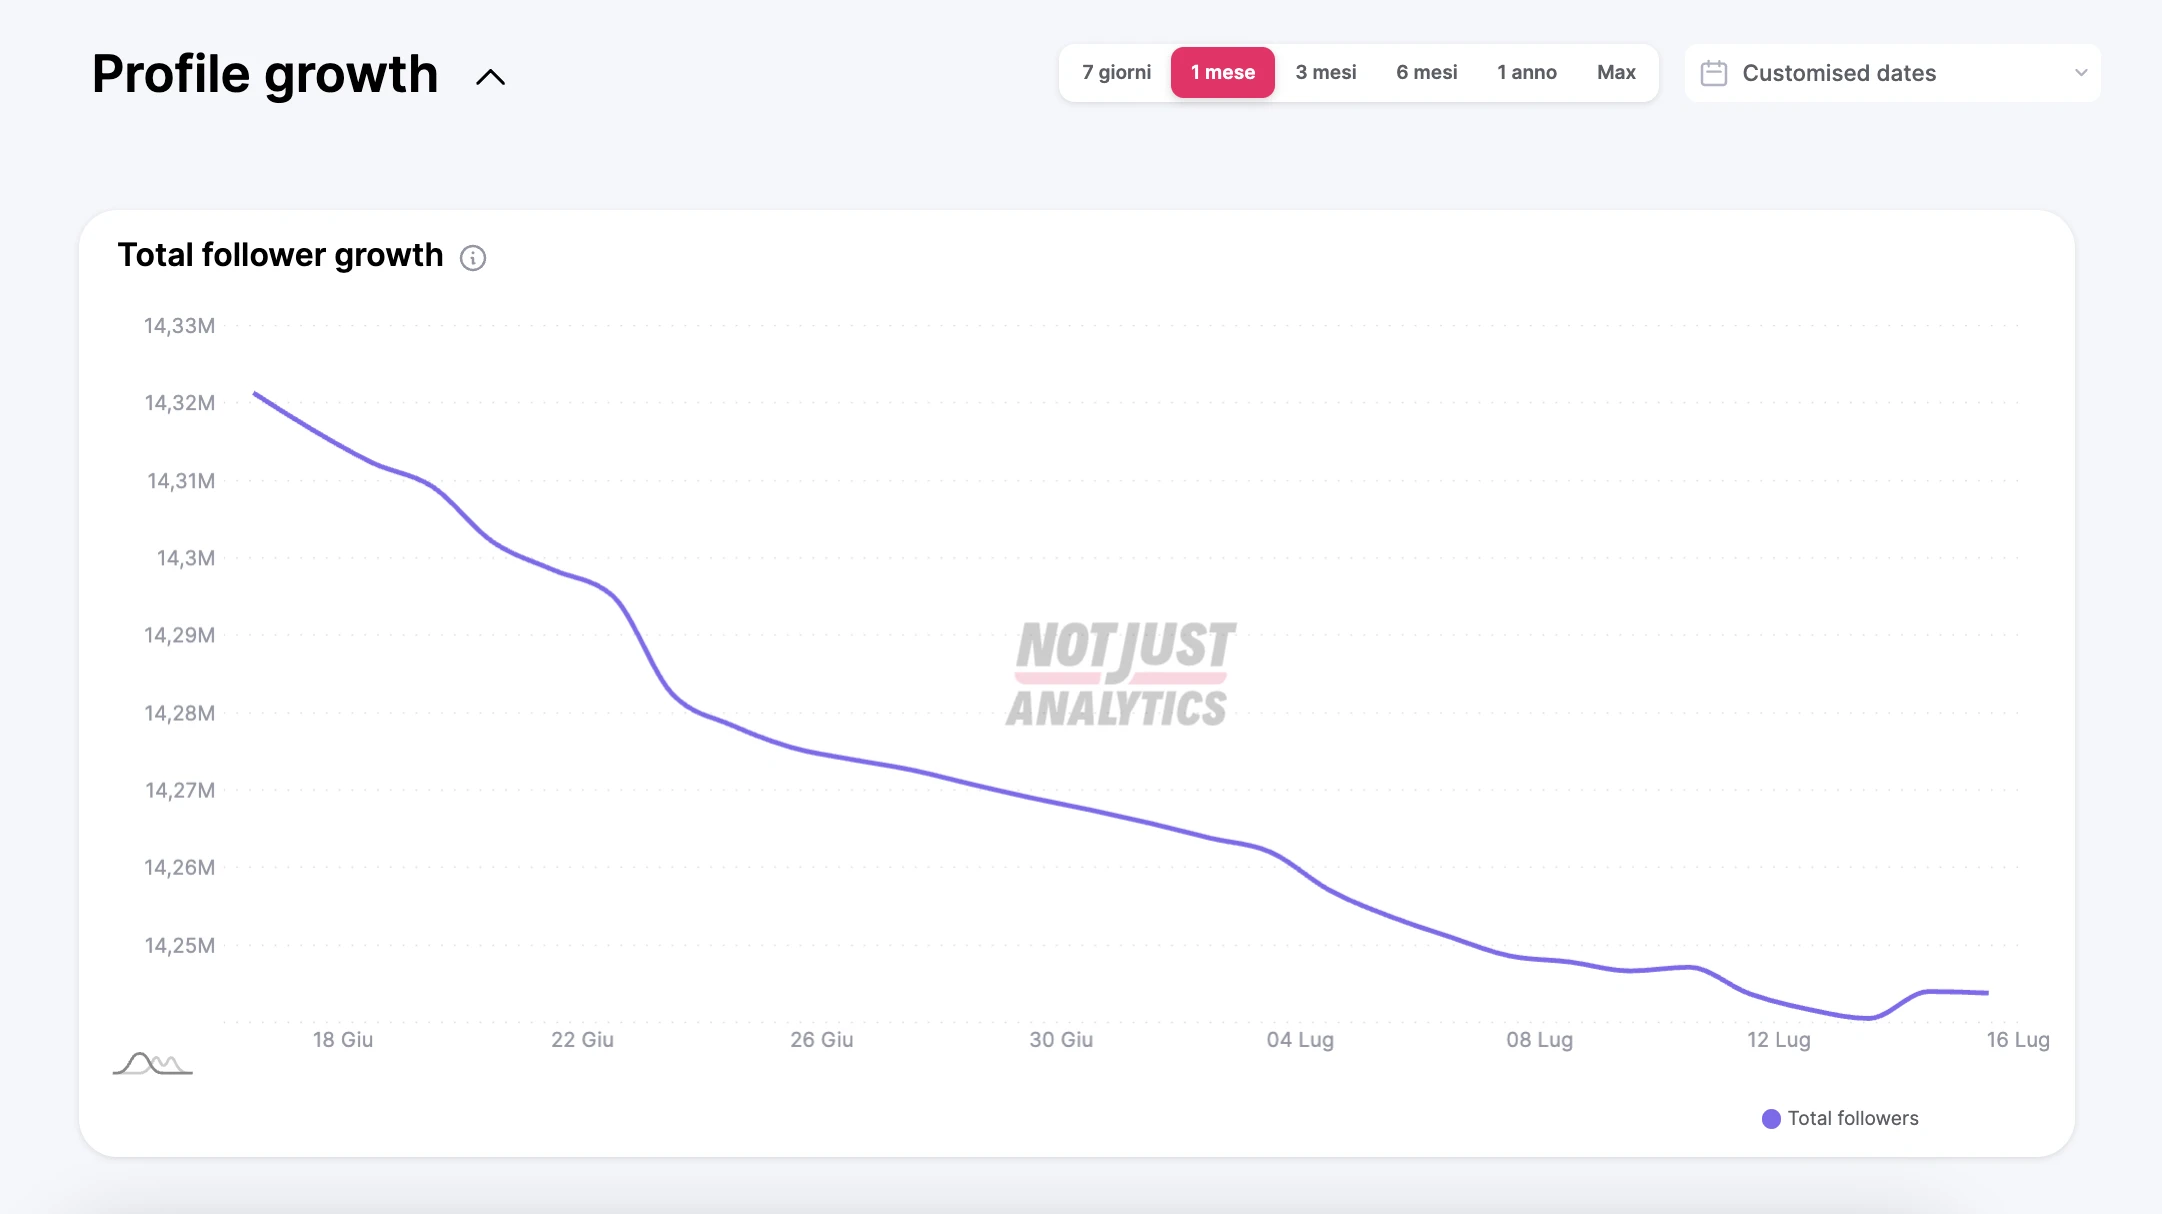
For casual users, nothing will change: you can still view the follower growth analysis chart on Instagram for the last 30 days, and the real-time events influencing its trend. However, if you use NJL for deeper analyses, here’s what you can do by choosing one of our subscriptions:
- Evaluating Influencers: you’ll continue to see the E.R. of profiles, but with an NJL subscription, you can discover additional data, like the Play Rate of Reels!
- Analyzing competition: you’ll still see the average likes and comments on posts, but with an NJL subscription, you can create lists to keep a close watch!
- Acquiring new clients: the analysis of the last 12 posts remains, but with an NJL plan, you can analyze much more data than what you’re used to in the free version, and even create reports with your insights to send!
Unlock the full potential of Not Just Analytics
To continue without limits, just activate any subscription to NJL (even the most affordable one!). Besides unlocking growth charts, you also get:
- Tips for your next post: receive personalized advice on what and when to post, based on your profile’s current algorithm phase and over 40 ideas for your next post!
- Personalized hashtags: find the best hashtags for your posts;
- Insights on reels: discover which Reels help you grow the most and the best times to post them;
- Complete reports: easily create and customize reports for your clients, adding comments and screenshots directly within NJL (goodbye copy-pasting in Canva);
- Reach distribution: analyze the reach of your content, between sponsored and organic posts (you can learn more here);
- Audience analysis: examine and compare in detail the demographic characteristics of your followers, the people reached, and those who interact with your content (you can learn more here).
Final thoughts
This change was a difficult but necessary decision to allow Not Just Analytics to grow. Indeed, a few weeks after introducing this limit, we’ve been able to accelerate many projects that were on hold and (finally) further expand our team. Visit this page to stay updated on the latest news and most important features we release.
Our commitment is to continue offering an increasingly better service, and we believe we’re on the right track! Thank you for being part of our adventure!
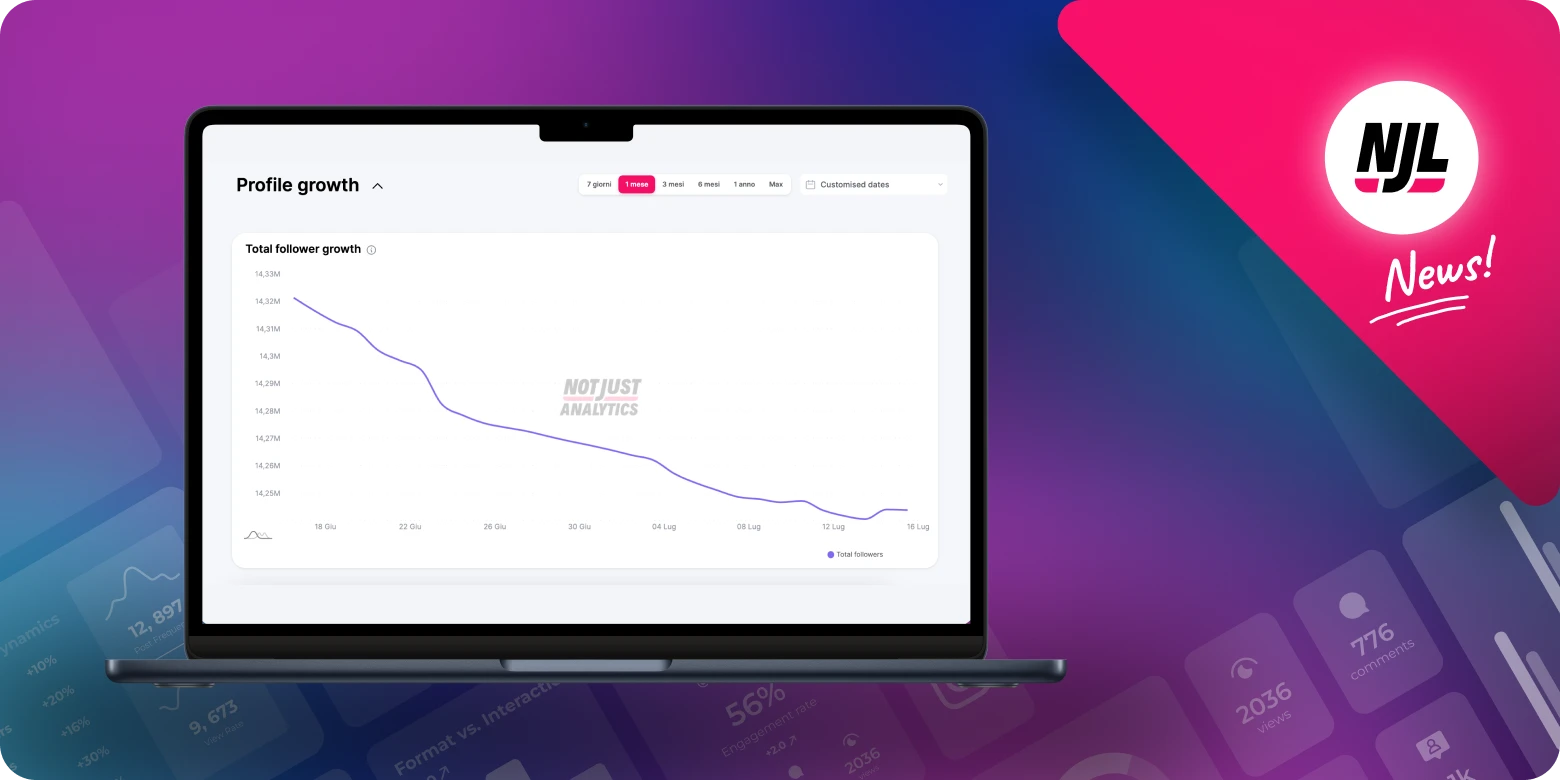
Hey, want to unlock the growth chart too? Click here!
Leave a Reply